The Datomic Peer Is a Cache. Here’s What That Means Under Load
Published:
A few days ago I was running a Datomic load test. Nothing fancy — a Clojure application using the Datomic Peer library, backed by a PostgreSQL Transactor, with Locust driving HTTP requests against a Ring API. I had just replaced the fixed step load shape with an infinite ramp: +100 users every 30 seconds, starting from 1.
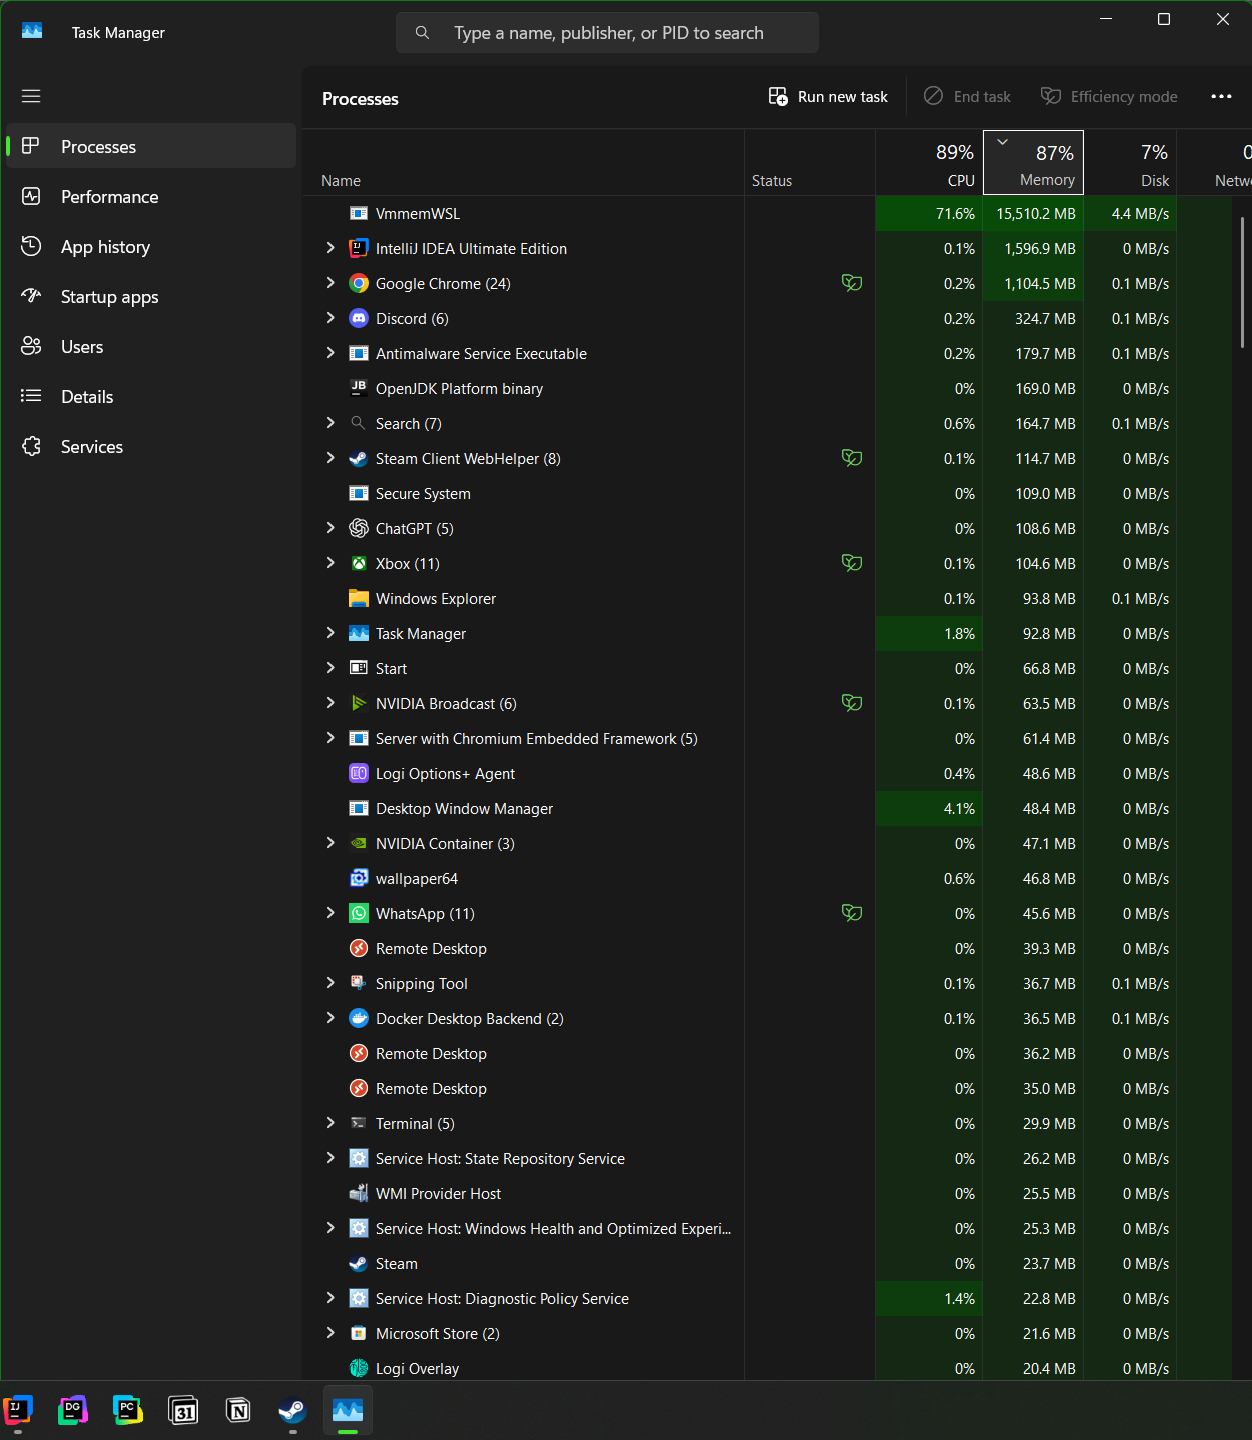
After about 25 minutes, the host Windows machine hit 89% CPU and 87% memory. The VmmemWSL process — the WSL2 VM running all my Docker containers — was consuming 15.5 GB of RAM. Locust was showing ~2,500 active users, a hard plateau at ~500 requests per second, and p50 response times that had climbed from ~10 ms to over 25,000 ms.
I hadn’t changed the data schema. I hadn’t changed the query logic. I had just added more users. So why was the machine running out of memory?
The Investigation
The first thing I did was check what was actually consuming memory. docker stats showed both JVM containers near their heap ceilings, so I went deeper with ps aux inside each container.
The numbers were striking:
| Container | Real memory (RSS) | Configured heap |
|---|---|---|
benchmark | ~8.5 GB | -Xms2g -Xmx8g |
transactor | ~2.6 GB | -Xms4g -Xmx8g |
| Total JVMs | ~11 GB |
The benchmark container — the Clojure application that uses the Datomic Peer library — had nearly filled its entire 8 GB heap. This wasn’t an OOM kill; the JVM was still running. It wasn’t a memory leak; the heap was filling with live objects that the garbage collector considered reachable and useful.
The heap was full because it was supposed to be full. I just hadn’t understood why yet.
The Datomic Peer Is a Cache
To understand what happened, you need to understand what the Datomic Peer library actually is — and it’s not what most database client libraries are.
In a traditional database setup — PostgreSQL, MySQL, MongoDB — the client library is essentially a thin messenger. It serializes your query, sends it over a socket, waits for the server to execute it, and deserializes the result. The client holds no data. The server is responsible for caching (PostgreSQL’s shared_buffers, MySQL’s buffer pool, MongoDB’s WiredTiger cache). Your application’s memory footprint is determined by your application logic, not the database driver.
Datomic inverts this model. The Peer library is not a thin client — it is a local read cache that runs in-process alongside your application. It holds an LRU cache of index segments: immutable chunks of Datomic’s persistent sorted index, each typically covering a few thousand datoms. When you run a query (d/q) or pull an entity (d/pull), Datomic checks this local cache first. On a hit, the answer comes from memory — no network round-trip, no Transactor involvement. On a miss, it fetches the segment from Memcached (if configured) or directly from storage, stores it locally, and answers from there.
Traditional DB:
  App → [thin driver] → network → [server: buffer pool] → disk

Datomic:
  App → [peer: object cache (LRU, in JVM heap)] → [Memcached] → [storage] → disk
                ↑
        reads never touch the Transactor
The cache is bounded by a JVM system property called datomic.ObjectCacheMax, which defaults to 25% of the JVM heap. This means that -Xmx — your JVM heap ceiling — is also your read cache ceiling. Giving the peer more heap directly increases the number of index segments it can hold, which increases the cache hit rate, which lowers read latency under load.
This is documented in Datomic’s caching documentation, but it’s easy to miss if you approach Datomic as just another database with a client library. The mental model shift is significant: when you size your peer application’s heap, you’re making a caching decision, not just a “how much memory does my app use” decision.
One more thing worth noting: each peer process has its own independent object cache. Two peer instances running the same query warm their caches separately. In production this is actually a strength — reads are purely local, they never go through the Transactor, and you can scale read capacity by adding peer processes without any shared bottleneck.
The Experiment as Proof
Back to the load test. At 2,500 concurrent Locust users with constant_pacing(1), that’s roughly 2,500 read requests per second against a dataset that was growing with every write. Each GET /read triggered a d/pull on a random entity. Each entity read could miss the object cache and pull a new index segment from PostgreSQL into the peer’s heap. The cache grew steadily until it hit the -Xmx8g ceiling. At that point, GC pressure spiked — the JVM was spending more time collecting than executing — and latency went nonlinear.
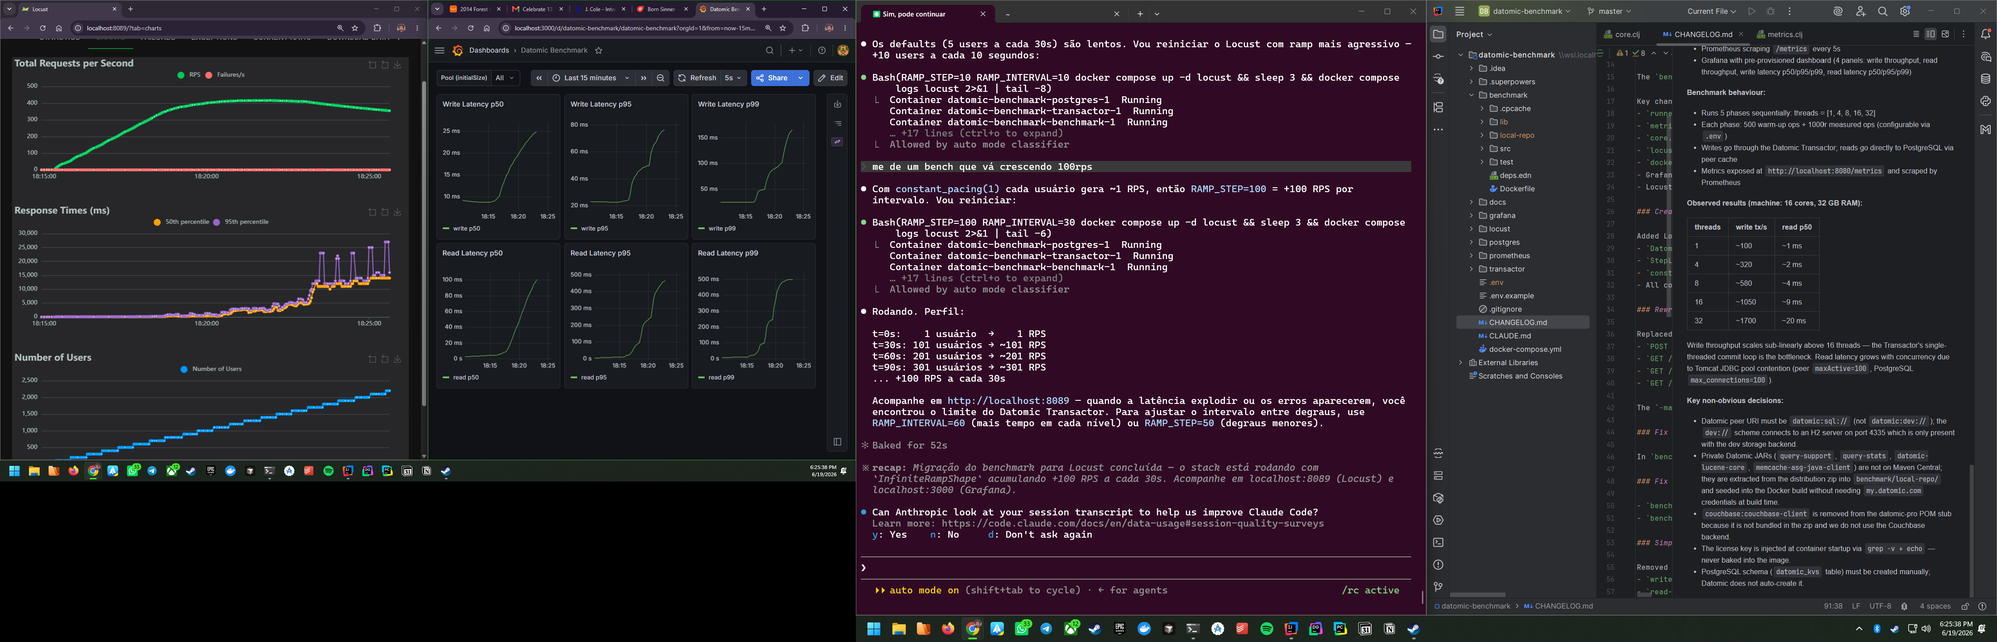
Locust’s RPS plateaued at ~500 despite 2,500 active users. With constant_pacing(1) each user should generate ~1 RPS; the gap between users and actual RPS shows that requests were taking longer than 1 second each — Locust couldn’t keep up. Write latency in Grafana stayed relatively stable (~30–40 ms p50), because writes go through the Transactor’s single-threaded commit loop — a separate bottleneck entirely, capped at ~500 tx/s regardless of read pressure.
The two bottlenecks are architecturally independent: write throughput is limited by the Transactor’s commit loop; read latency under high concurrency is limited by the peer’s object cache size (i.e., -Xmx).
Bonus Gotcha: deploy.resources.limits Is a Swarm-Only Field
While investigating, I noticed the docker-compose.yml had memory limits defined — so why weren’t they enforced?
# This is silently ignored in docker compose up (non-Swarm mode):
deploy:
  resources:
    limits:
      memory: 8G

# This actually works:
mem_limit: 4g
The deploy.resources.limits field is a Docker Swarm concept. In regular docker compose up, it is silently ignored. The containers ran without any memory ceiling, allowing the JVMs to grow freely to their -Xmx limits. Using mem_limit at the service level is the correct way to cap memory in a standard Compose setup.
Takeaways
-Xmx sizes your read cache. When running a Datomic peer application, heap sizing is not just about “how much memory does my app need” — it’s a caching decision. More heap means more index segments in the object cache, which means higher cache hit rates and lower read latency under concurrent load.
Multiple peers mean multiple independent caches. Unlike a shared Memcached cluster, each peer warms its own object cache independently. Adding a peer process adds read capacity without contention on a shared layer. The Datomic caching docs describe how Memcached and Valcache can optionally sit between the object cache and storage for larger deployments — but the local cache is always the first layer.
Honest benchmarks need enforced resource limits. deploy.resources.limits in Docker Compose is a Swarm-only directive. Use mem_limit to actually cap containers when running locally. Without it, the JVMs ran uncapped and consumed whatever the host could give them — which made the benchmark less reproducible and harder to reason about.